Binning is sinning
You should never bin your data, you hear people saying.
But what if you really really want to?
let’s bin!
First, we create fake sinusoidal data
import numpy as np

t = np.linspace(0, 10, 1000)
y = 5*np.sin(t) + np.random.randn(t.size)
which we now want to bin in bins of 0.5.
width = 0.5
bins = np.arange(t.min(), t.max()+width, width)
scipy has a handy function for this:
from scipy.stats import binned_statistic
which can be used as
binned_y = binned_statistic(t, y, bins=bins)[0]
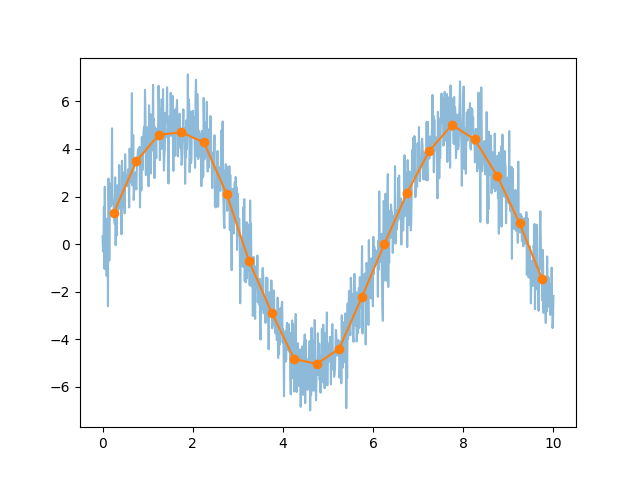
Let’s plot the result
import matplotlib.pyplot as plt

plt.plot(t, y, alpha=0.5)
plt.plot(bins[1:] - width/2.,  binned_y, 'o-')

more options
By default, binned_statistic calculates the mean of the data inside each bin.
But we can calculate other statistics, as explained in the
documentation.
The statistic optional argument can be:
statistic : string or callable, optional
    The statistic to compute (default is 'mean'). The following statistics are available:
        'mean'   : compute the mean of values for points within each bin.
        'median' : compute the median of values for points within each bin.
        'count'  : compute the count of points within each bin.
                   This is identical to an unweighted histogram.
        'sum'    : compute the sum of values for points within each bin.
                   This is identical to a weighted histogram.
        'min'    : compute the minimum of values for points within each bin.
        'max'    : compute the maximum of values for point within each bin.
        function : a user-defined function which takes a 1D array of values,
                   and outputs a single numerical statistic.
                   This function will be called on the values in each bin.
                   Empty bins will be represented by function([]), or NaN if this returns an error.
wrap-up
That’s it, a simple handy function to bin data!
Let me know in the comments if this is helpful, wrong or super-duper cool.